Background
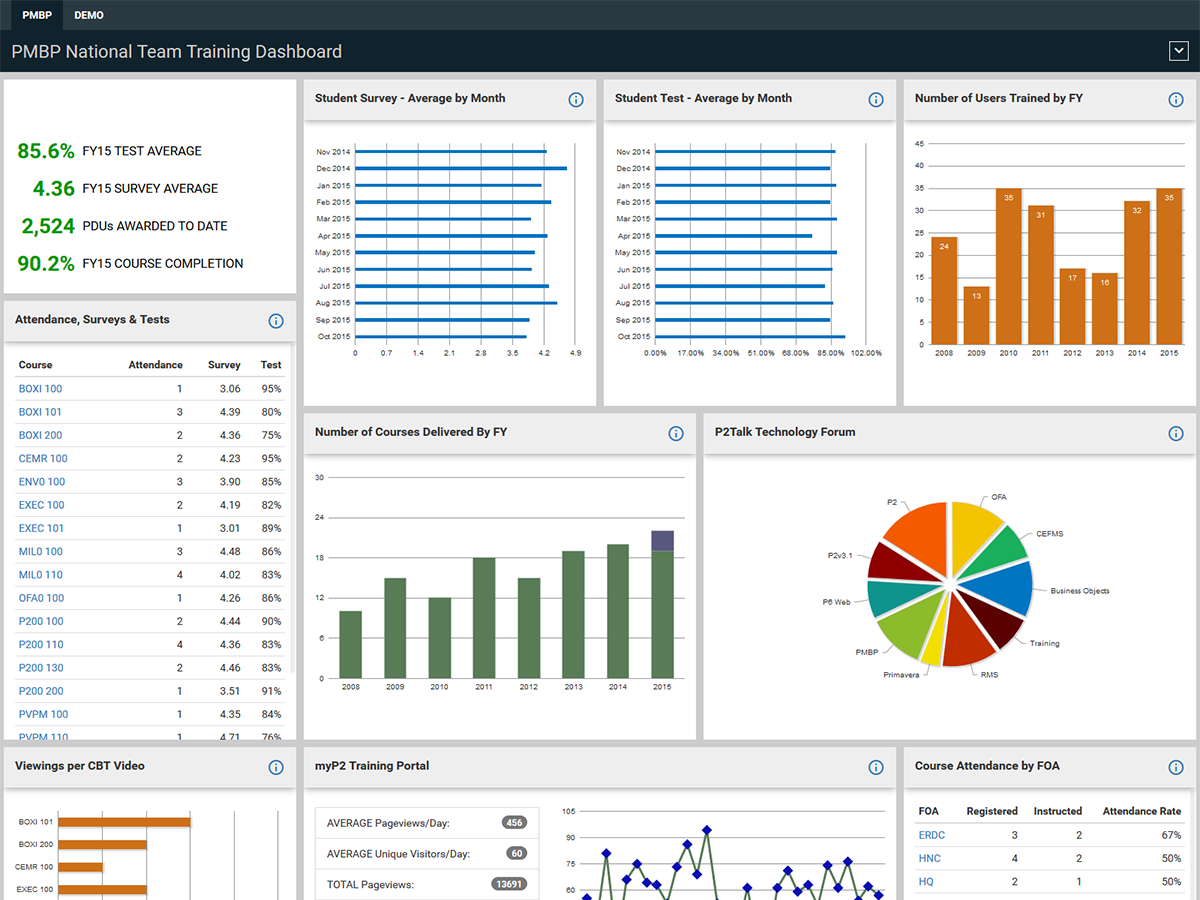
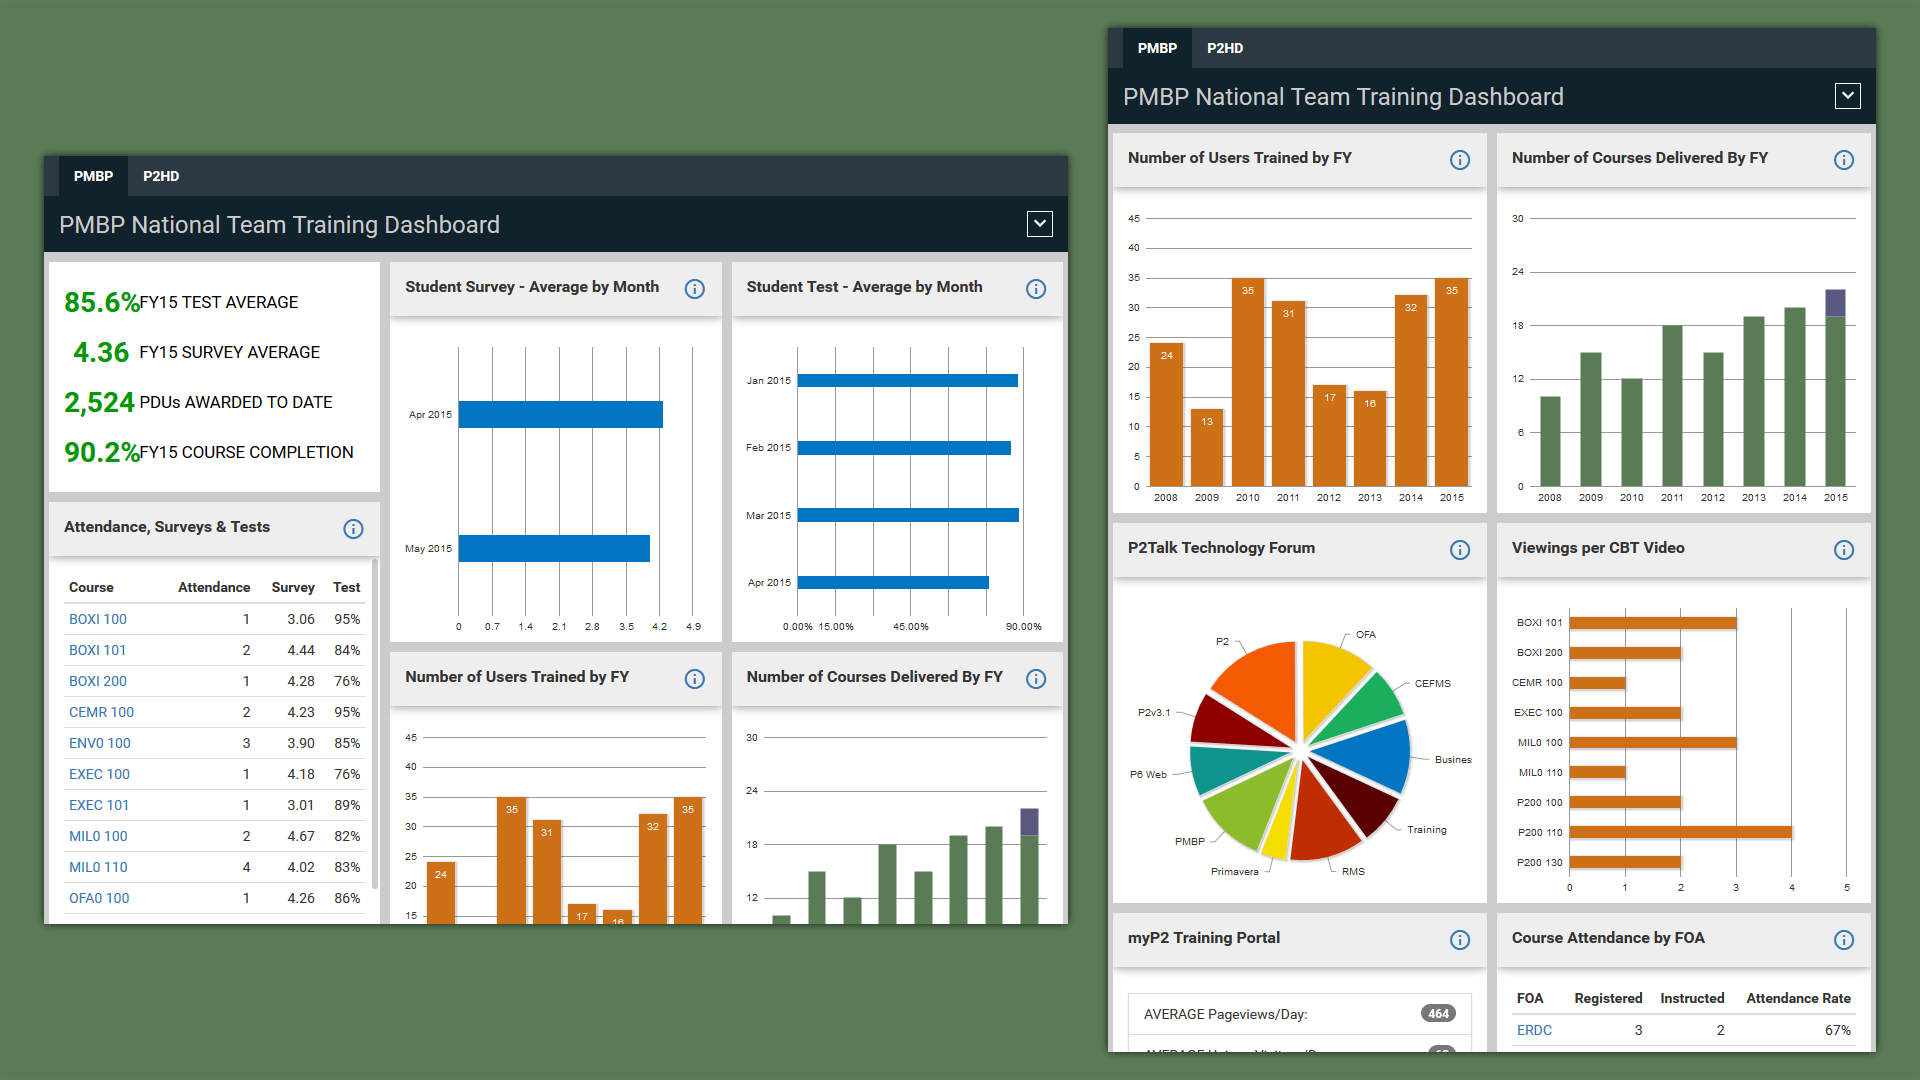
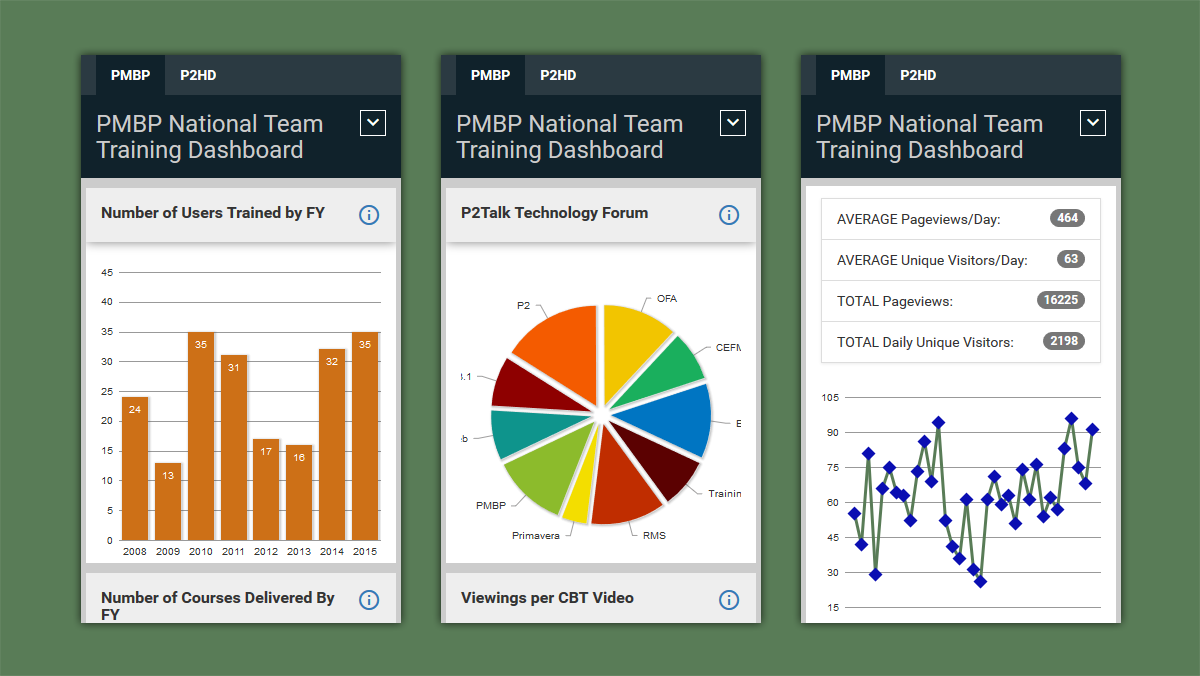
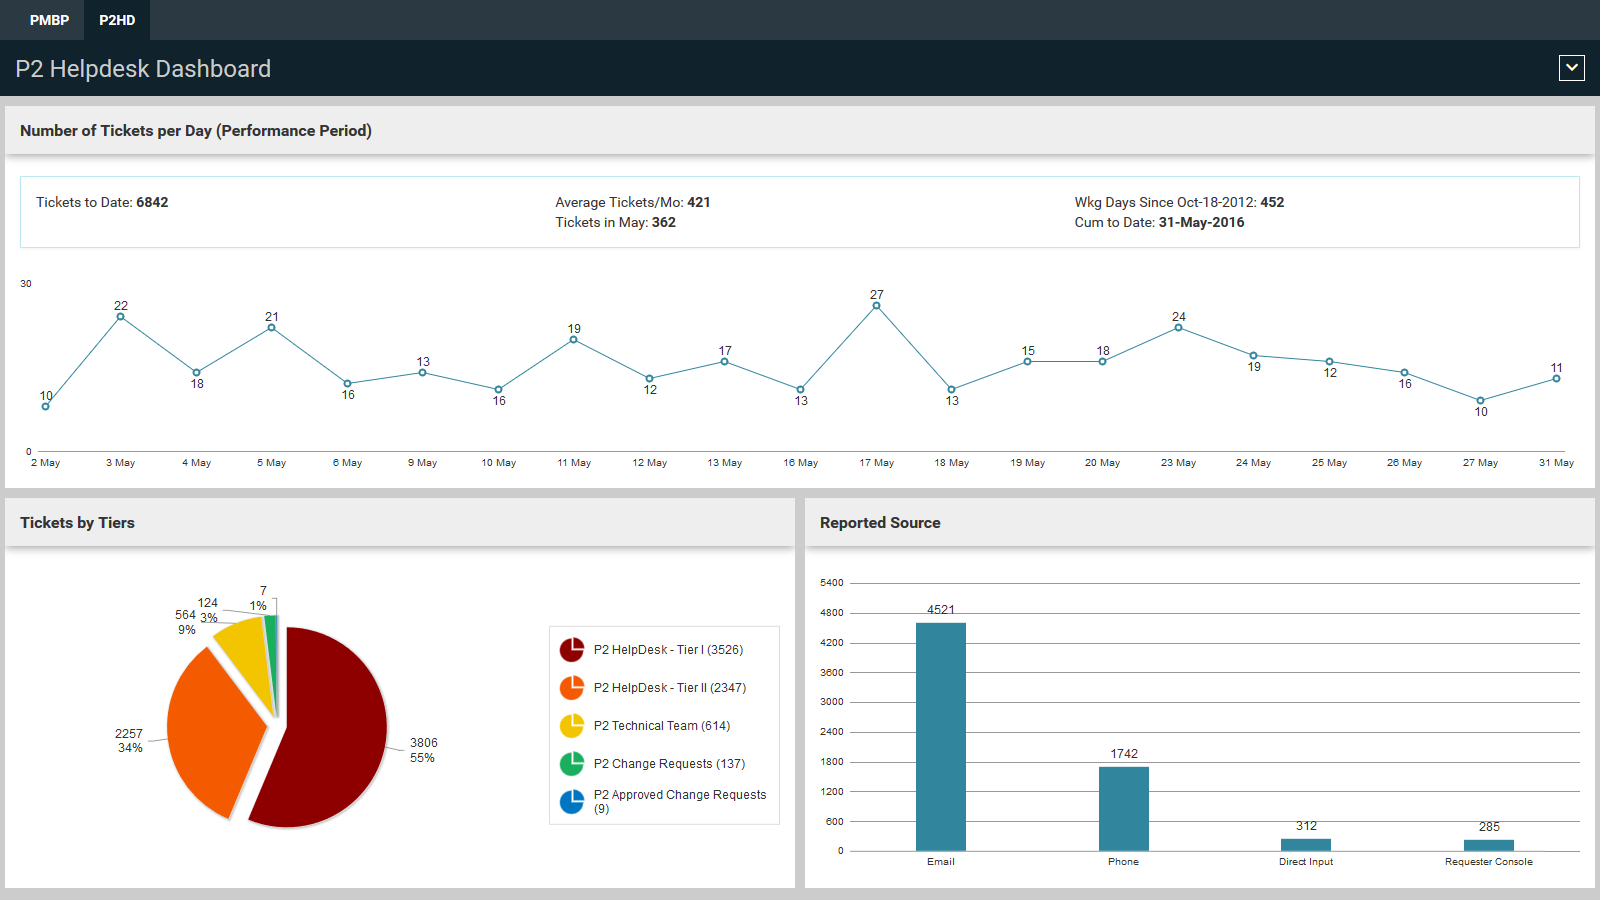
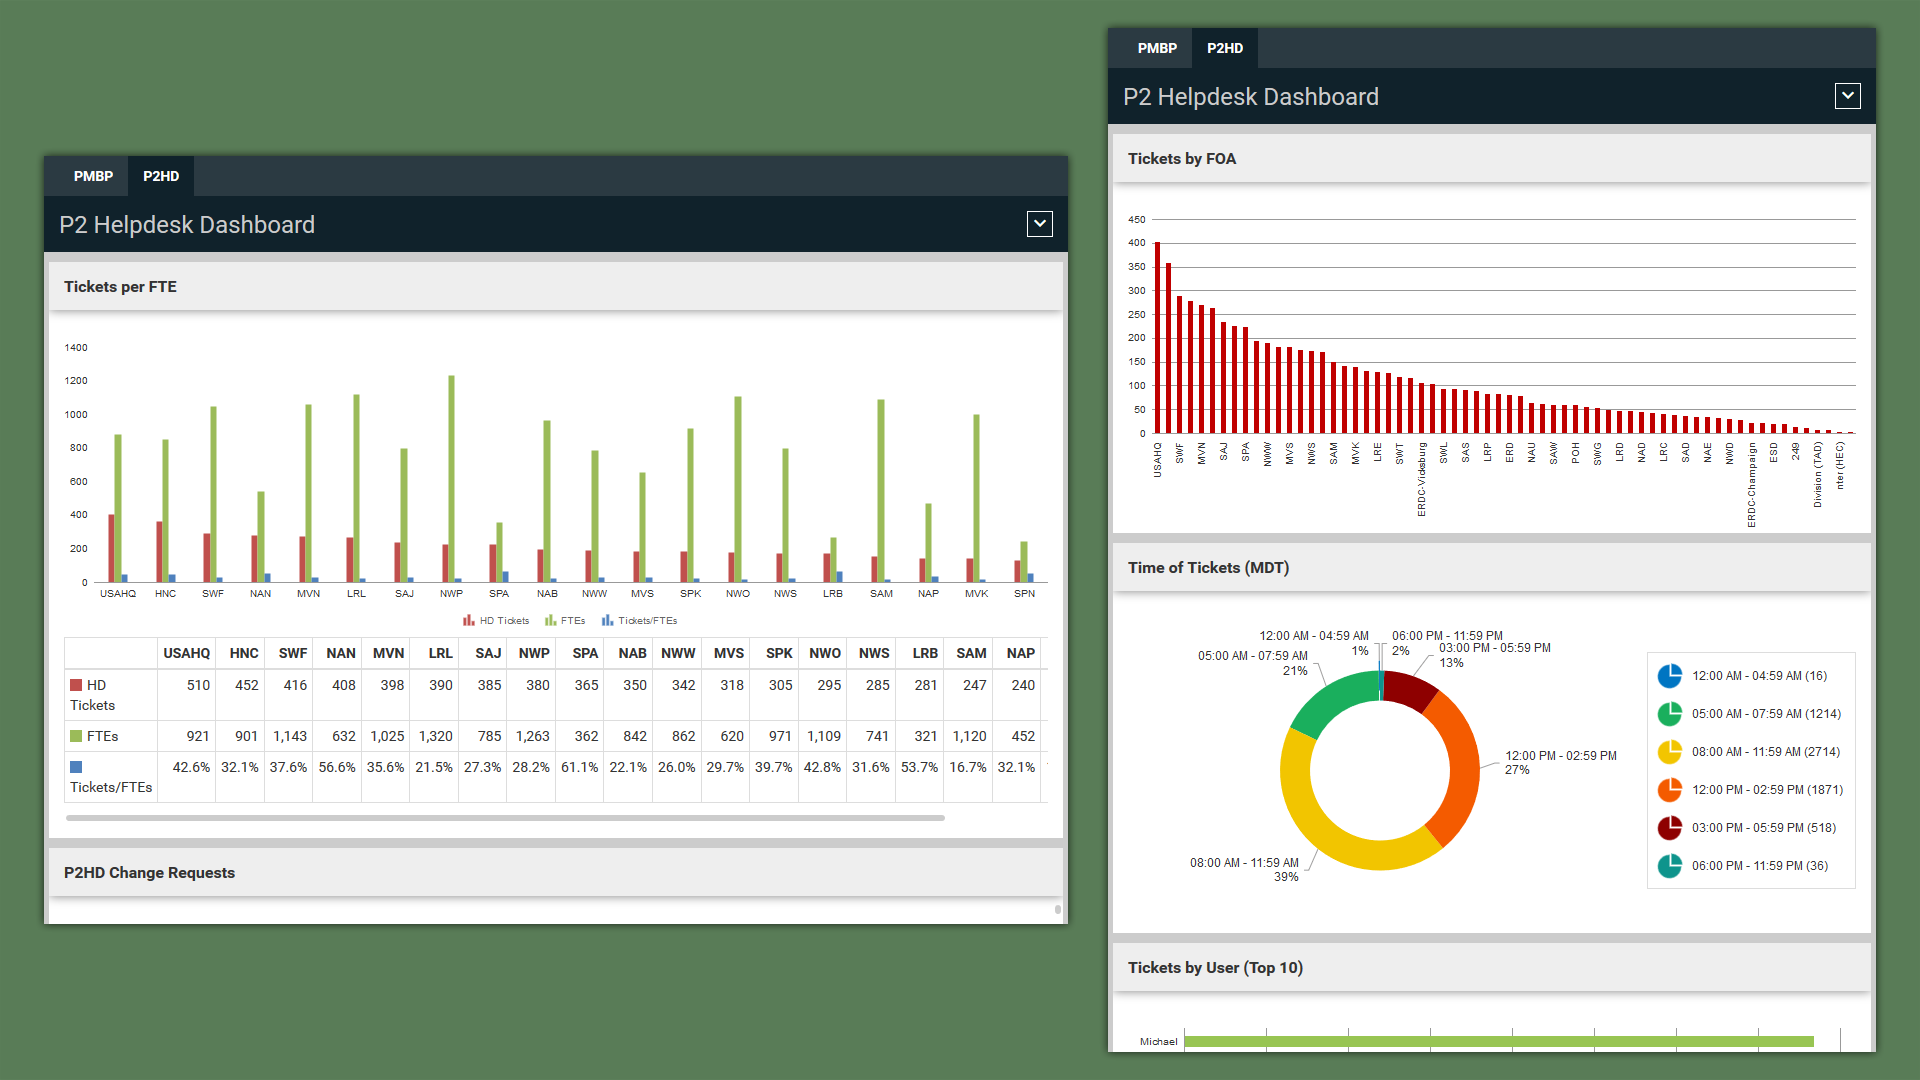
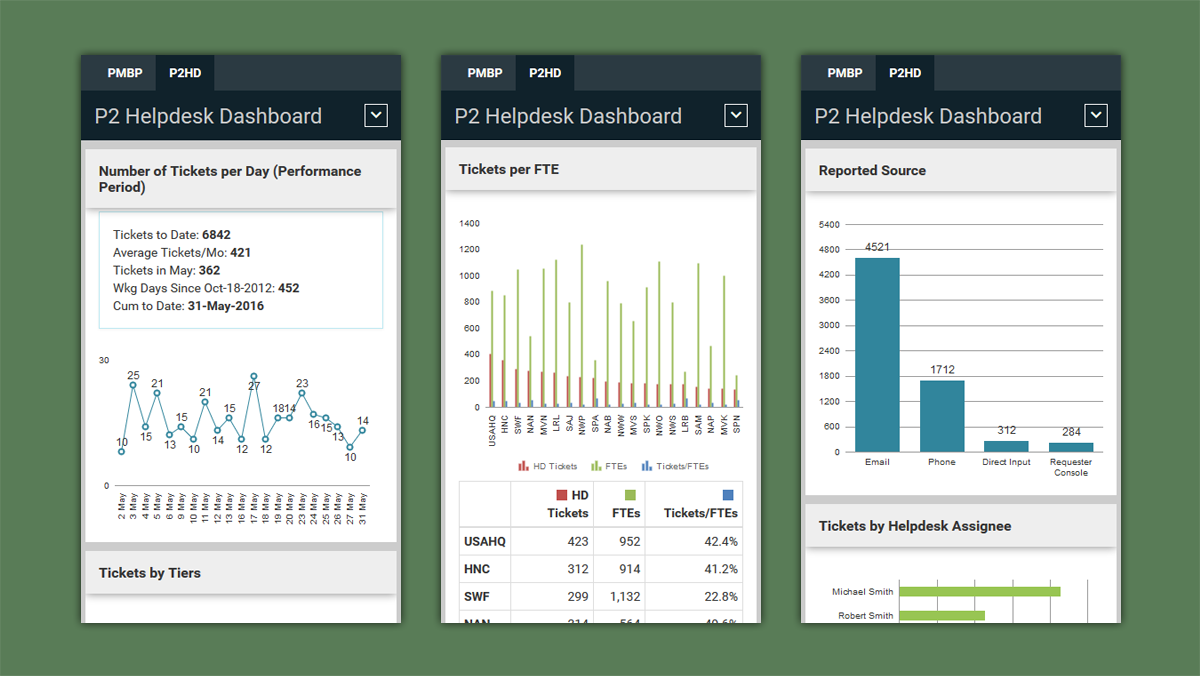
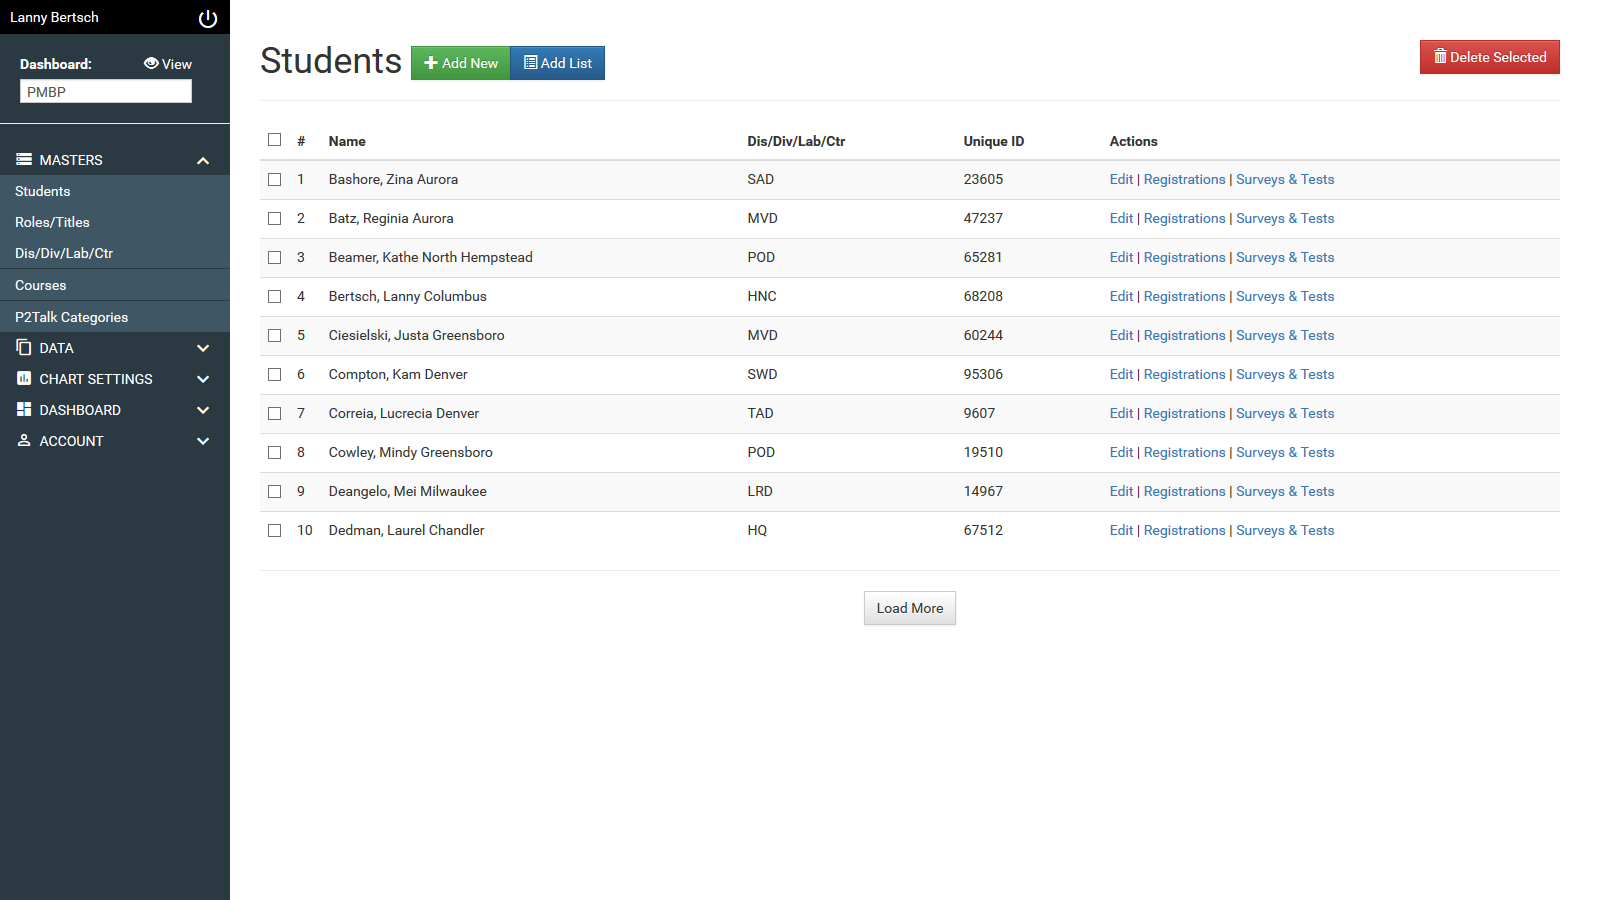
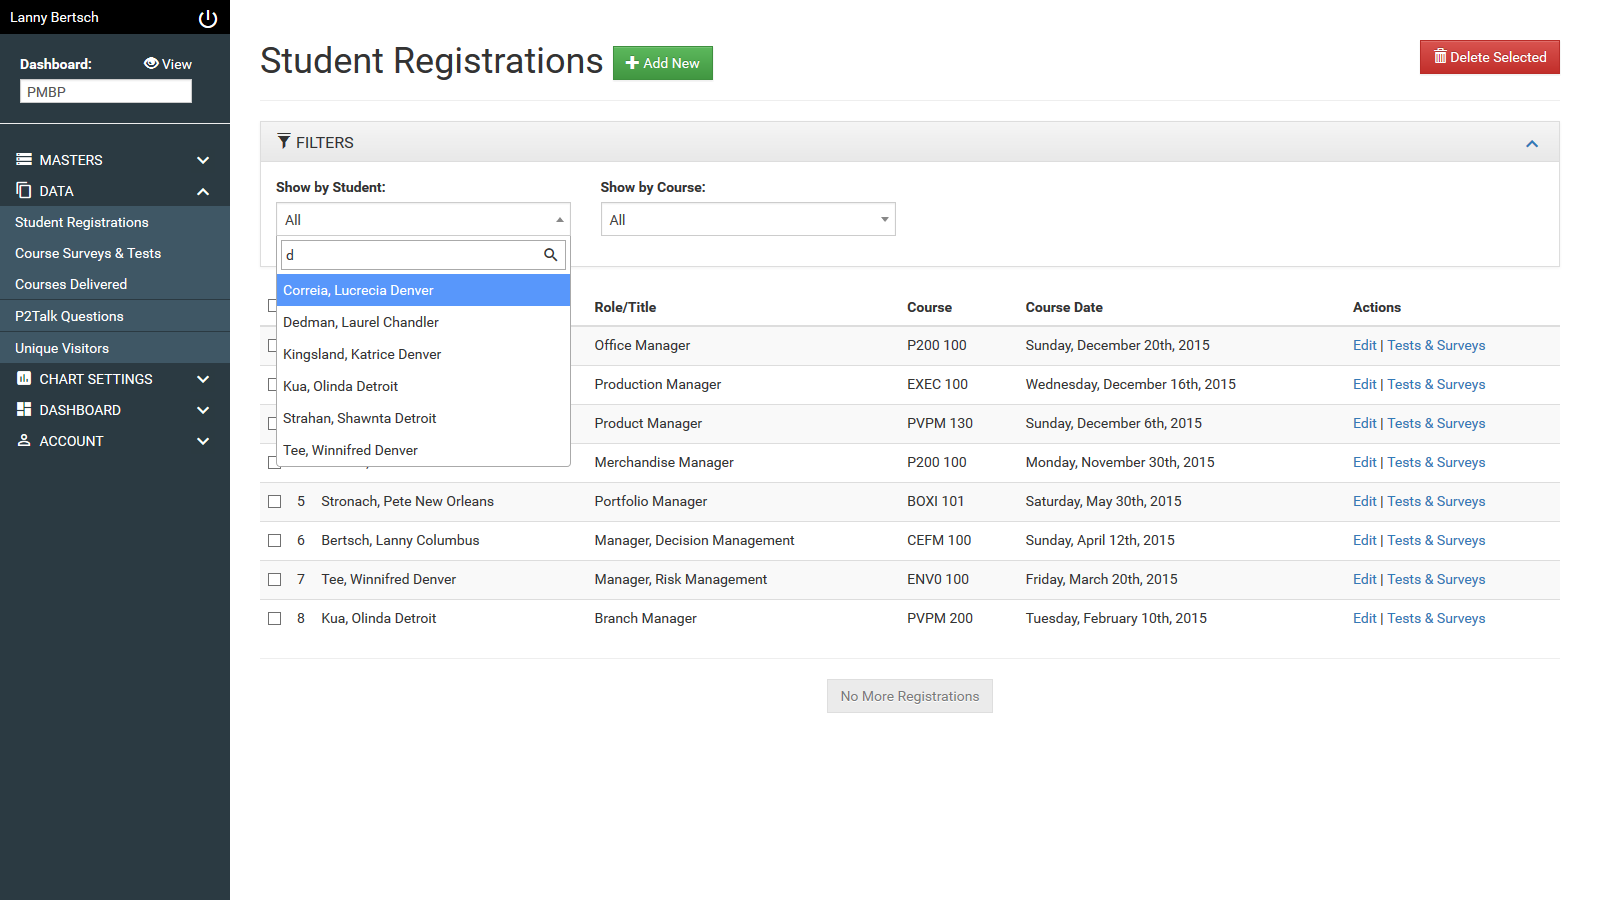
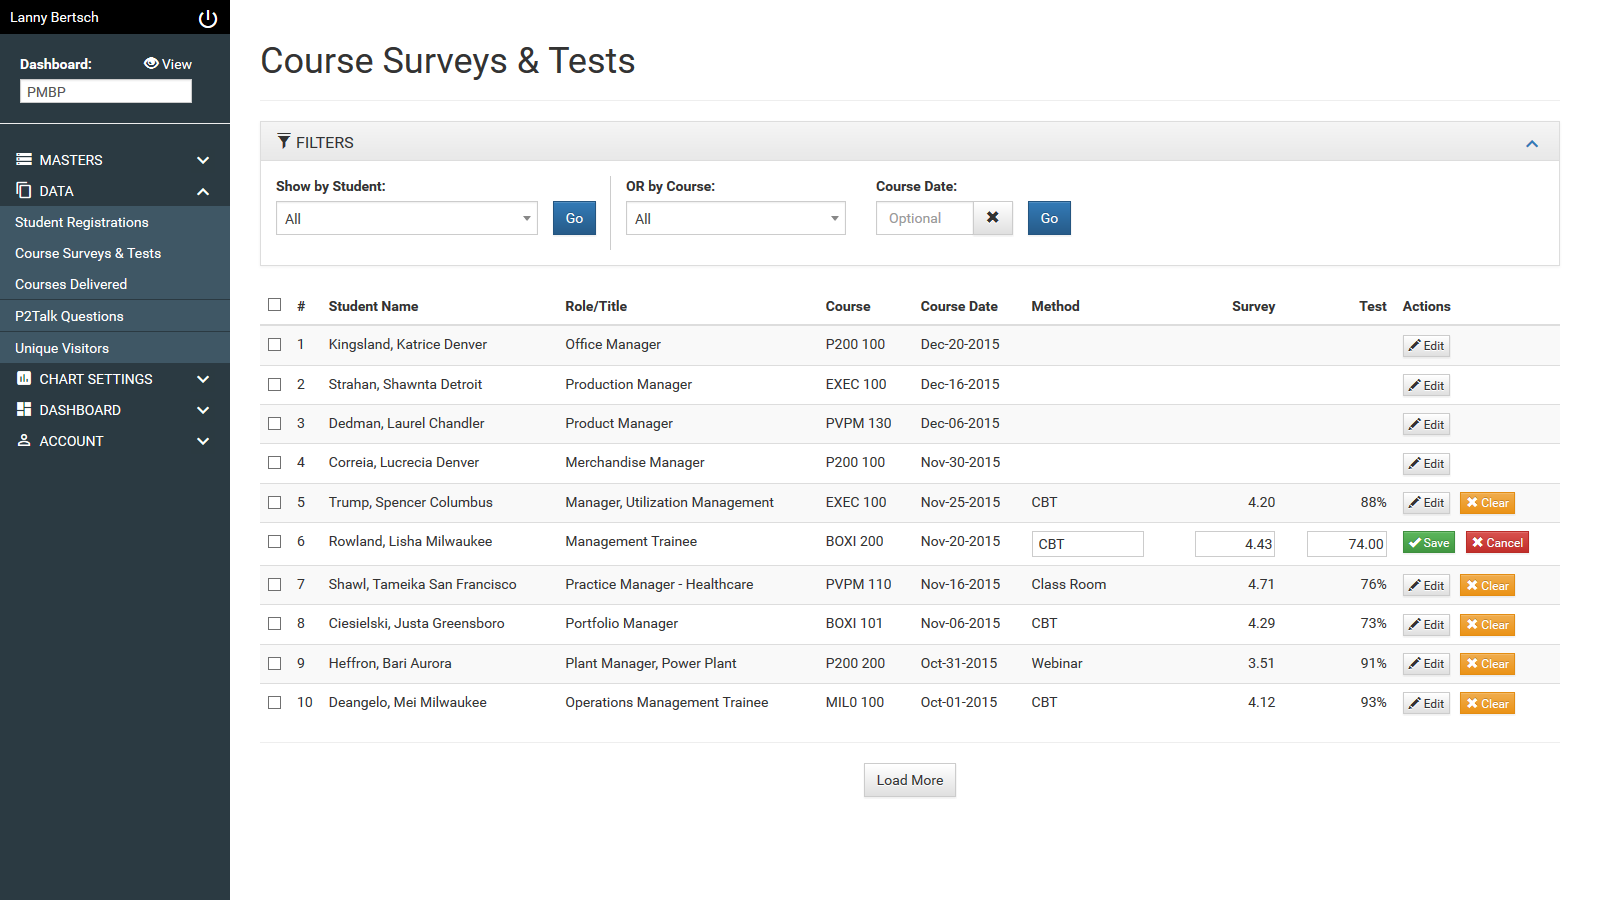
We were approached by a management consulting firm based in New Mexico to develop a reporting portal for their training service. The platform was required to allow the upload of various data in different formats, generate multiple dashboards, and display different charts and graphs. Additionally, the portal needed to enable users to download dashboards in both Excel and PDF formats. The charts and graphs were to be fully customizable and configurable to an advanced level.
Solution
Our team aided the client in the development of their portal, which was architected in a manner that divided its functions into discrete microservices, such as chart data processing, and Excel and PDF generation. We employed FusionChart to construct the portal’s charts and graphs, and implemented an innovative approach within the backend application to manage the look and feel of each chart. Additionally, we integrated several features into the backend application, such as bulk uploading and editing of diverse raw data, and the ability to customize charts to meet the client’s requirements.
Services Provided
Tech Stack
- AWS Lightsail
- FusionCharts
- MySQL
- PHP
Brit H
Owner, AgileGroup USA
Smart Smart Smart. And insightful questions about your project, before they start, not after. On time delivery